
The Assessment We Use
Woodcock-Johnson IV
Description:
The Woodcock-Johnson IV (WJ-IV) has 11 subtests in the Standard Battery and an additional 9 subtests in the Extended Battery. We administer the Broad Reading and Math Calculation Skills clusters from the Standard Battery as part of our annual achievement test.
The problem with most standardized testing is that some students need less time and some need more time. The beauty of this test is that each student gets exactly the time he/she needs, is not rushed to finish, nor is waiting for others to finish. The WJ-IV is not a timed test, though there are 3 sections in the Standard Battery: reading fluency, math fluency, and writing fluency; that are timed (3/3/5 minutes). Depending on the version administered, a student may not have one of these sections, or all 3. The clusters we administer during spring testing have only the reading fluency and math fluency tests that are timed. Students typically do not find this problematic, as the sections are brief.
This test is non-bracketed, which means that a child can rise to his or her ability, rather than being confined to questions at their chronological grade level. Each child is assessed using the material appropriate to age and level of accomplishment, working toward higher material until he/she answers incorrectly 6 consecutive items, finishes the subtest, or time runs out, depending on the subtest.
Broad Reading
TEST 1: Letter-Word Identification – This subtest measures the student’s word identification skills. The individual reads words aloud from an increasingly difficult vocabulary list and is not required to know the meaning of any of the words.
TEST 4: Passage Comprehension – This subtest measures the individual’s understanding of what was read. The student reads a sentence silently and then decides on a specific word needed in the blank to make the sentence complete. Vocabulary level increases throughout the section.
TEST 9: Sentence Reading Fluency – This subtest measures reading rate. In this subtest the student reads simple sentences and circles “Yes” or “No” on an answer sheet, responding accurately to as many items as possible in 3 minutes.
Math Calculation Skills
TEST 5: Calculation – The student is given a worksheet of calculations to complete of increasing difficulty. Topics begin with number recognition, basic arithmetic operations, fractions, decimals, percents, negative numbers, and then progress to some geometric, trigonometric, logarithmic, and calculus operations.
TEST 10: Math Facts Fluency – This subtest measures speed of computation, the ability to solve simple addition, subtraction, and multiplication facts quickly. The student is given several sheets of simple math calculations, responding accurately to as many items as possible in 3 minutes.
Are There Different Kinds of Standardized Tests?
There are many kinds of standardized tests that are used for a variety of purposes with both children and adults. The annual standardized test we use at Brookwood Christian is the Woodcock-Johnson IV Form C.
The CLUSTERS indicated by use of ALL CAPS are determined by using combinations of the Tests shown below the CLUSTERS, using Standard Capitalization.
Because this test can take an excessive amount of time to administer all parts and it covers far more than we need, we have selected the tests that best serve what is best for our students. We do NOT want to create an undue source of stress for our students, many of whom have struggled with self-esteem issues and anxiety from traditional public school testing.
All students receive the sections, which produce the CLUSTERS, in RED. Higher grade students, who are more used to and comfortable with testing, also receive sections, which produce the CLUSTERS in BLUE. If your student is missing a section, it may be because he/she was showing undue signs of nervousness or anxiety, and we just tested the areas we absolutely NEEDED.
The beauty of this test is that each student gets exactly the time he needs, not rushed to finish, nor waiting for others to finish. This is not a timed test, though there are 2 sections: reading fluency and math fluency that are timed (3 minutes each).
*(please note that these are the WJIII test descriptions, which are similar. We will have the WJIV updates soon).
This is a norm-referenced test. These tests are not designed to measure a specific curriculum, but rather the knowledge generally taught at a particular grade level. Results from a norm-referenced test compare a student’s performance to a national reference group (the “norm”) of students at the same grade. Individual results on these tests are usually reported using a variety of scores, explained below.
What Achievement Tests Can and Cannot Do
Remember that a standardized achievement test cannot measure the sum total of your child’s progress. It is only one assessment tool designed to measure a certain set of skills.
Achievement Tests CAN:
• Measure a child’s ability to recall certain facts, basic skills, and concepts common to the grade tested
• Compare a child’s scores with other students’ scores.
• Assess a child’s year-to-year development of learning, if the same test is used for several years.
• Help determine a child’s academic strengths and weaknesses, as well as the effectiveness of a curriculum, teaching methods, or emphasis, when results are combined with teacher or other professional observations.
Achievement Tests CANNOT:
• Tell if a child as achieved academically to the level of his ability/potential.
• Measure a child’s other skills and abilities not on the test.
• Replace a teacher’s professional evaluation of a child’s knowledge and skills gained from daily observation of his work and more thorough and frequent review questions.
NOTE: This is the sole purpose of testing at Brookwood Christian.
Interpreting the Score
Raw Scores: A raw score is the number of items answered correctly on a given test. Raw scores by themselves have little or no meaning. A child’s Raw Score (number correct) is compared to the original group of students of the same age who first took the test. The averages of this original group are called the “Norms”. Norm referenced test scores compare a child’s raw score to the norm group. Next, a child’s raw scores are converted into scaled scores, grade equivalents, percentiles and stanines.
SCALED SCORE: this is a mathematical transformation of a raw score. These are useful when comparing test results over time. Most standardized achievement tests provide scaled scores for such purposes. Several different methods of scaling exist, but each is intended to provide a continuous score scale across the different forms and levels of a test series.
GRADE EQUIVALENT: This is the most commonly misunderstood term in interpreting test scores. The first digit represents the year of the grade level and the digit after the decimal represents the month of that grade level. If 7th grade Johnny obtains a grade equivalent score of 9.1on a reading comprehension test, this means that he obtained the same score as the typical student in the first month of ninth grade. Johnny may or may not have acquired the same skills as the typical ninth grader. It also very likely means the 7th grader mastered the material very well and answered most of the questions correctly. See below for actual score report we use.
PERCENTILE: This score ranks individuals within a group on a scale of 1-99 with 50 being average. A percentile rank of 75 means the student scored better than 75 percent of the other students in his or her norm group, and 25 percent scored as well or better than your student. There is no such thing as the 100th percentile because a child can’t do better than himself. It does not mean the student got 75% of the items correct. Percentile does not refer to the percent of questions that were answered correctly.
STANINE: This term comes from the combination of the words “standard of nine”. It rates a child’s achievement on a scale of 1-9 based on a coarse grouping of the scores. In general, a stanine of 1, 2 or 3 indicates below average achievement. A stanine of 4, 5 or 6 indicates average achievement, while 7, 8 or 9 indicates that as student is above average.
RELATIVE PROFICIENCY INDEXES (RPI): show the examinee’s level of proficiency (accuracy, speed, or whatever is measured by the test) at the level at which peers are 90% proficient. An RPI of 90/90 would mean that, at the difficulty level at which peers were 90% proficient, the examinee was also 90% proficient.
Sample Score Report
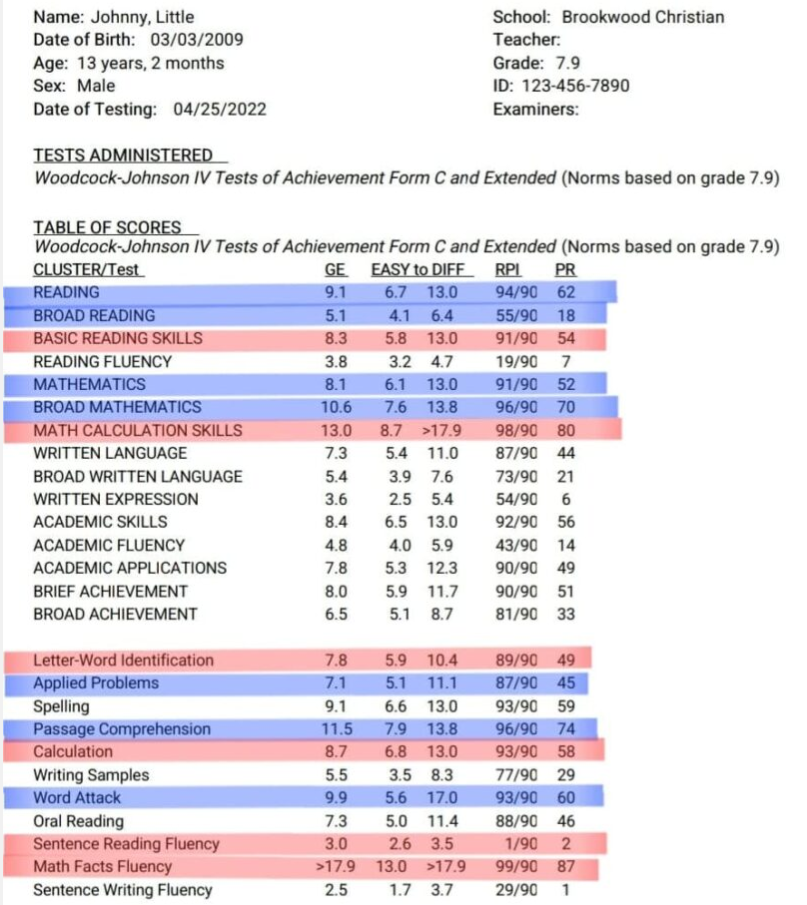
A score report will show the current grade level performance of the student in the first column, Johnny’s is 7.9 (7th grade 9th month)
For each CLUSTER and Test, there will be a confidence band, EASY to DIFF column which will show the likely range of scores if Johnny were to take this test countless times, with the GE being what he scored on this particular test. So for the BASIC READING CLUSTER, Johnny scored 8.3 with a confidence band indicating he probably could score anywhere from 5.8 to 13.0 if he repeated the very same test.
As long as the confidence band straddles the grade placement level, then we tend to say the student is performing on grade level for that skill set. The entire confidence band being higher, such as MATH CALCULATION SKILLS CLUSTER and Math Facts Fluency Test could mean that grade level work may seem easy, but not necessarily that Johnny is ready for the next grade. It could indicate he needs more challenging in that area.
If the confidence band is entirely below grade level, such as BROAD READING and Sentence Reading Fluency is in this case, then this may be an area of difficulty for Johnny and it’s possible he may struggle with grade level work without adequate support. This is an area we would watch closely, especially that another area involving writing seems on the low side.
Again, this is just a ‘snapshot’ of Johnny’s performance on ONE DAY, for no more than ONE HOUR. It’s also very possible that Johnny is doing very well and just had an “off” day. We look at these scores along with report cards and teacher input to make any decision for placement.
What we don’t want to see is the bars not moving as the grade placement moves up. Often, within a year or two, we see bars moving closer to grade placement and very often passing it. As long as there is improvement over time, not necessarily all areas in just one year, then we are moving in the right direction.
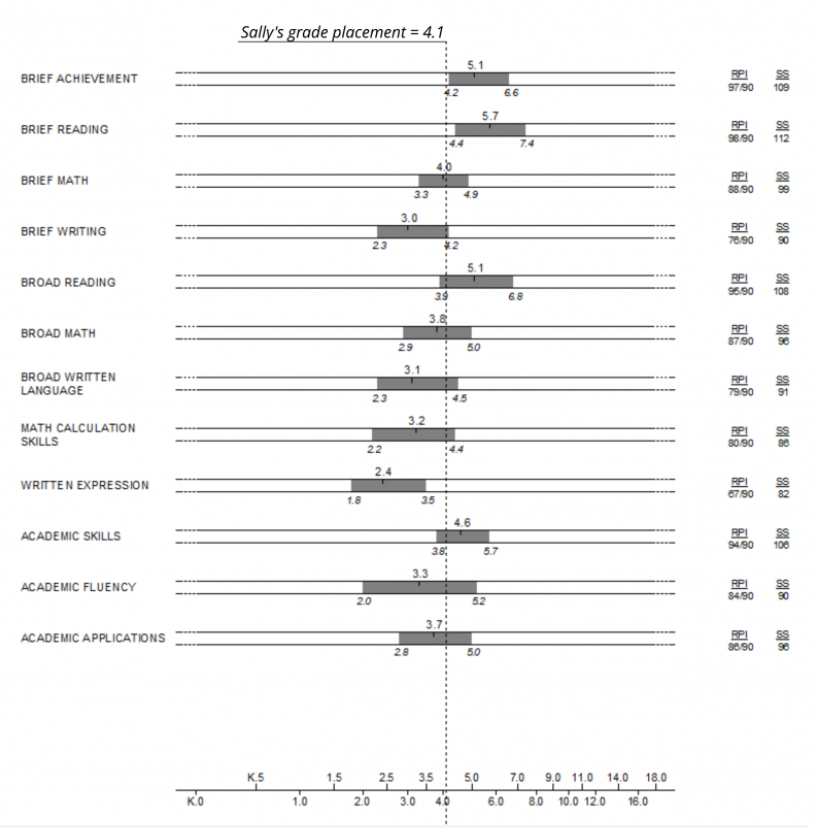
This is for WJIII score reports ~ The older version of the test we used prior to this year
A score report will show the current grade level of the student with a vertical dashed line, Johnny’s Older sister, Sally was grade 4.1 at this time.
For each section of the test, there will be a confidence band (the grey strip) which will show the likely range of scores if Sally were to take this test countless times, with the center number being where she scored on this particular test. So for the Brief Math test, Sally scored 4.0 with a confidence band indicating she probably could score anywhere from 3.3 to 4.9 if she repeated the very same test.
.jpg)